
Joules per Terahash: The Input Most Miners Overlook
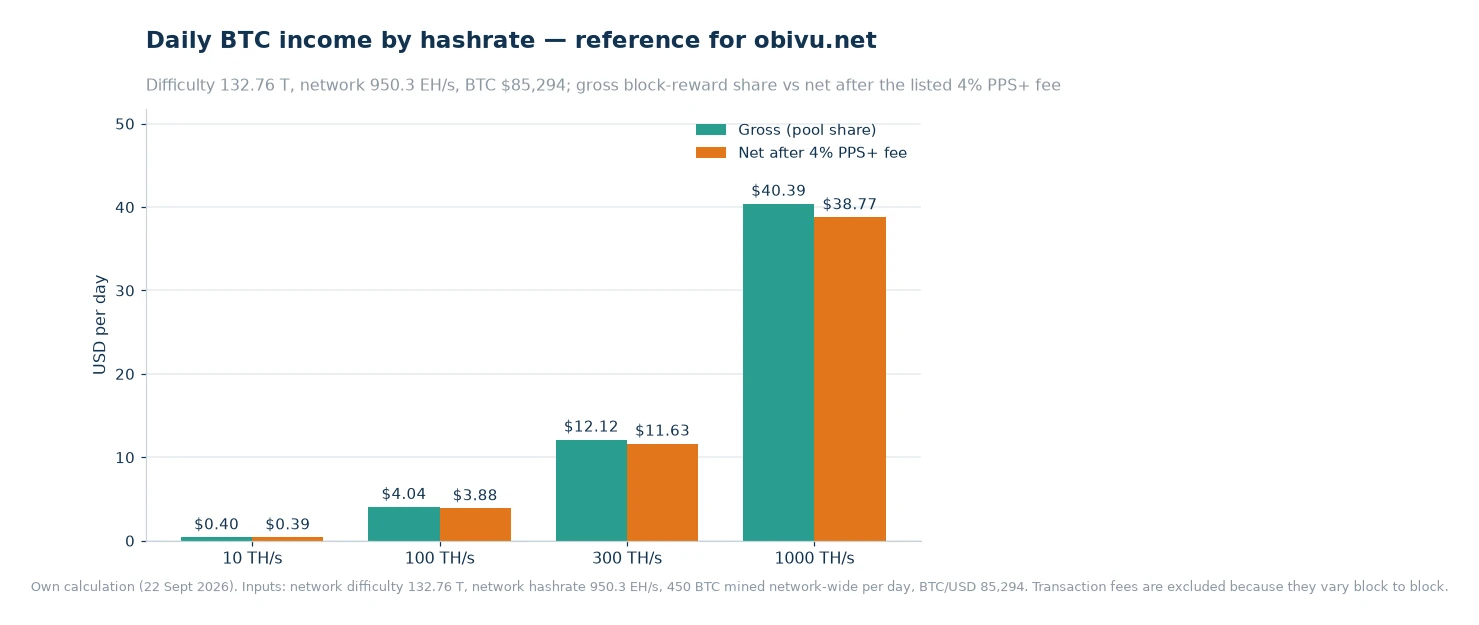
Two machines can hash at exactly the same rate and finish the month in different places, because joules per terahash, not terahash, decides the power bill. At 100 TH/s on a $0.06/kWh supply a 15 J/TH rig keeps about $1.72 a day after electricity, while a 30 J/TH rig of identical hashrate is $0.44 a day short. Both are measured against $3.88 a day of income after the listed 4% block-reward fee.

Key takeaways
- J/TH converts hashrate into kilowatts: at 20 J/TH one TH/s draws 0.48 kWh a day, at 15 J/TH it draws 0.36 kWh, at 30 J/TH it draws 0.72 kWh.
- On a $0.06/kWh supply the after-fee margin runs from $0.0172 per TH/s a day at 15 J/TH to a shortfall of $0.0044 at 30 J/TH.
- At 1 PH/s the same comparison spans $17.17 a day in margin at 15 J/TH and a loss of $4.43 a day at 30 J/TH.
- Pool fees matter less than efficiency: the listed 4% on the block-reward component is about $0.0081 per TH/s a day against a $0.06/kWh power bill at 20 J/TH.
Efficiency decides the margin, not the hashrate
Income per unit of hashrate is the same for everyone. At network difficulty 132.76 T and an implied network hashrate of 950.3 EH/s, one TH/s produces about 0.0000004735 BTC a day, which is $0.0404 at $85,294 per BTC. After the listed 4% is taken from the PPS-settled block-reward component, $0.0388 remains. Nobody negotiates with those numbers, and a single rig sees exactly the same figures as a warehouse.
Cost per unit of hashrate is entirely a choice. Joules per terahash states how much energy a machine spends to sustain one terahash per second, so it converts a hashrate figure into a kilowatt figure. At 20 J/TH each TH/s carries 20 W, or 0.02 kW, which is 0.48 kWh across a day. At 15 J/TH the same terahash carries 0.36 kWh; at 30 J/TH it carries 0.72 kWh.
Multiply those figures by the power price and the only line item that differs between sites appears. On a $0.06/kWh supply, power costs $0.0288 per TH/s a day at 20 J/TH, $0.0216 at 15 J/TH and $0.0432 at 30 J/TH. Set them against the $0.0388 that arrives after the listed fee and the margin per terahash is $0.0100, $0.0172 and minus $0.0044 respectively.
Same hashrate, three different bills
The table below holds hashrate constant at one terahash and changes nothing but efficiency. That is the comparison an estimator should make first, because it isolates the input most models bury behind a default value that nobody updates.
| Efficiency | Power per day | Power cost per day | Income after the listed 4% | Margin per day | At 100 TH/s |
|---|---|---|---|---|---|
| 15 J/TH | 0.36 kWh | $0.0216 | $0.0388 | $0.0172 | $1.72 |
| 20 J/TH | 0.48 kWh | $0.0288 | $0.0388 | $0.0100 | $1.00 |
| 30 J/TH | 0.72 kWh | $0.0432 | $0.0388 | minus $0.0044 | minus $0.44 |
Read the last column as the price of patience. An operator who buys the 30 J/TH unit because it was cheaper on the invoice has bought a machine that consumes its own income at this power price, while the 15 J/TH unit doubles the margin of the middle row. Efficiency is the one spec that keeps paying after the hardware is delivered.
Worked example
Scale the same three machines to 1 PH/s, which is 1,000 TH/s. Income first: 1,000 × $0.0404 = $40.39 a day before fees, and $38.77 a day after the listed 4% is applied to the block-reward component. That is about $1.62 an hour at current difficulty.
Now the power, at $0.06/kWh. The 15 J/TH fleet draws 15 kW and consumes 360 kWh a day, a bill of $21.60, leaving $17.17 a day. The 20 J/TH fleet draws 20 kW and burns 480 kWh, a bill of $28.80, leaving $9.97 a day. The 30 J/TH fleet draws 30 kW and burns 720 kWh, a bill of $43.20, which is $4.43 a day more than the income it produces.
Look at the middle case hourly, because that is how the income arrives. A 20 kW load costs $1.20 an hour at $0.06/kWh. The same hour of hashing earns $1.62 after the listed fee. The margin is 42 cents an hour, and it exists only because the efficiency rating is good enough to keep the kilowatts below the reward.
Feeding J/TH into one estimate
The ViaBTC Mining Calculator takes the inputs that decide this outcome — price, difficulty, listed fee and effective hashrate — and returns a daily figure, so the efficiency assumption becomes visible rather than implicit. The Profit Calculator does the same job on a smaller scale: write every input down with its date and the division stays honest. The failure mode is mixing two vintages of difficulty in one comparison, which makes an efficient machine look worse than it is.
Two reference points are worth keeping open while you compare. The pool statistics page shows the network difficulty the estimate should be using, and the Miner Profitability Ranking lists machines by what they earn at the current network rather than at the price and difficulty of their launch month.
Mistakes that hide the real cost
The first is using a datasheet J/TH instead of a measured one. Ratings are quoted at a reference temperature and a reference voltage; a hot container, a long cable run or an ageing power supply can add several joules per terahash without changing a single line of the specification sheet.
The second is treating the power price as a constant. If the site pays a peak tariff, the daily average understates the hours when the machine works hardest, and the margin calculated above quietly assumes the cheapest hours all day. The third is assuming difficulty holds still: the next adjustment is estimated at +1.90%, and a rise of that size trims income per TH/s by a similar proportion while the kilowatt hours stay exactly where they were.
Frequently asked questions
Is J/TH more important than hashrate?
For margin, yes. On a $0.06/kWh supply the after-fee income is $0.0388 per TH/s a day while the power cost runs from $0.0216 to $0.0432 per TH/s depending on efficiency, so the rating decides whether a machine adds money or absorbs it.
How do I convert J/TH into kilowatt hours?
Multiply the rating by 24 and divide by 1,000 for kWh per TH/s per day. At 20 J/TH that is 0.48 kWh; multiply by the power price, $0.06/kWh here, for $0.0288 a day per TH/s.
Where does the listed fee fit in the comparison?
It comes off income, not off power. The listed 4% on the PPS-settled block-reward component is roughly $0.0016 per TH/s a day at the current reward, which is smaller than the spread between a 15 J/TH and a 30 J/TH machine at any realistic power price.
Rank machines by joules, then by price
Put the J/TH figure first, because it sets the floor under everything else, and let purchase price decide between machines that are close on efficiency. Write the kilowatt hours per TH/s next to each candidate, apply your own power contract, and check the result against a single dated difficulty rather than last quarter's screenshot. When a fleet is already installed, the same division tells you which units to curtail first when power prices spike, and the answer is almost never the smallest machine.
Figures and sources: the listed ViaBTC fee schedule[1], pool statistics[2] and the miner profitability reference[3]. Network difficulty 132.76 T, implied network hashrate 950.3 EH/s, the 3.125 BTC subsidy behind 450 BTC a day network-wide and the $85,294 BTC price were read 22 Sept 2026. These are worked multiplications, not a forecast; change the difficulty or the price and every line shifts with it, so nothing here is a commitment about what any machine will earn.